 Trends
Global agriculture often brings to mind images of independent farmers working vast fields. Reality tells a very different story. Behind almost every seed planted, every acre fertilized, every crop harvested, and every bushel exported sits a highly consolidated network of massive multinational corporations.
As we analyze 2026, market concentration has reached unprecedented levels.
- Just four companies control over 50 percent of the global grain trade.
- Another handful of chemical and seed giants dictate what varieties of crops farmers can grow and what inputs they must buy to protect them.
- Meanwhile, a highly consolidated heavy equipment sector determines how those crops are physically managed, setting the prices for tractors, combines, and precision technology.
Understanding this corporate ecosystem is critical for anyone involved in farming, heavy equipment trading, or global supply chains. When a few corporations dominate supply chains, they hold immense power over global food security, commodity pricing, and equipment access. For individual farmers and regional dealers, this consolidation means fewer choices and tighter margins.
This comprehensive industry report breaks down the largest agriculture companies in the world in 2026. We will examine how this massive market is structured, how different segments interact to extract value, and what drives the scale of these agribusiness giants. We will also explore how corporate dominance impacts the agricultural machinery market, limiting traditional supply channels and forcing buyers to seek alternative global marketplaces to secure essential equipment.
Key Insights from 2026 Agriculture Market
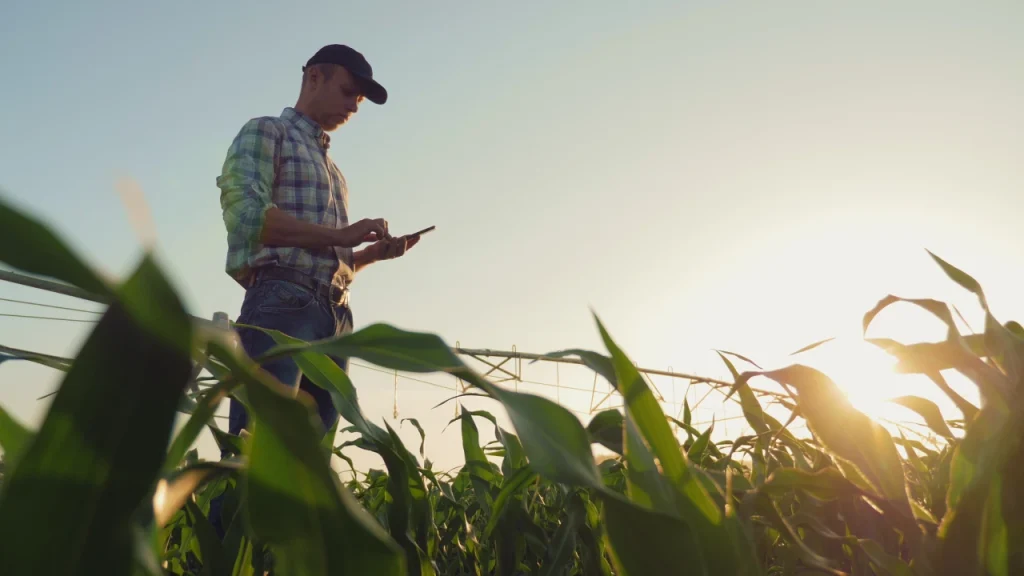
Analyzing data from global organizations like the Food and Agriculture Organization and major industry reports reveals several structural realities shaping how food and machinery move across borders.
Market Concentration Remains High in Key Segments
In agricultural inputs, consolidation is well documented. According to the Organisation for Economic Co-operation and Development, the global seed market is highly concentrated, with the top four firms controlling more than 50% of the market following major mergers in recent years.
In grain trading, the sector is dominated by a small group of multinational firms often referred to as the ABCD companies (ADM, Bunge, Cargill, Louis Dreyfus), which collectively control a significant share of global agricultural commodity flows.
Industry Is Driven by Traders and Input Providers
Global agricultural trade volumes continue to expand, with the Food and Agriculture Organization projecting that agricultural production will need to increase by around 50% by 2050 to meet demand, reinforcing the central role of trading houses and input suppliers in scaling output.
Vertical Integration Is Accelerating
Major agribusiness firms are expanding across the value chain. For example, companies are increasingly combining seeds, chemicals, and digital tools into integrated offerings, while traders invest in processing and logistics infrastructure to secure supply chains.
Global Supply Chains Are Deeply Interconnected
Agricultural trade is highly globalized. The Food and Agriculture Organization notes that a large share of food production is traded internationally, with complex supply chains linking producers in regions like South America to major demand centers such as China. Disruptions in one region can therefore quickly affect global prices.
Data Is Becoming a Critical Asset in Agriculture
Digital agriculture is expanding rapidly. According to McKinsey & Company, precision agriculture technologies can increase crop yields while reducing input costs, driving adoption of data-driven farming platforms and connected equipment.
How Global Agriculture Market Is Structured
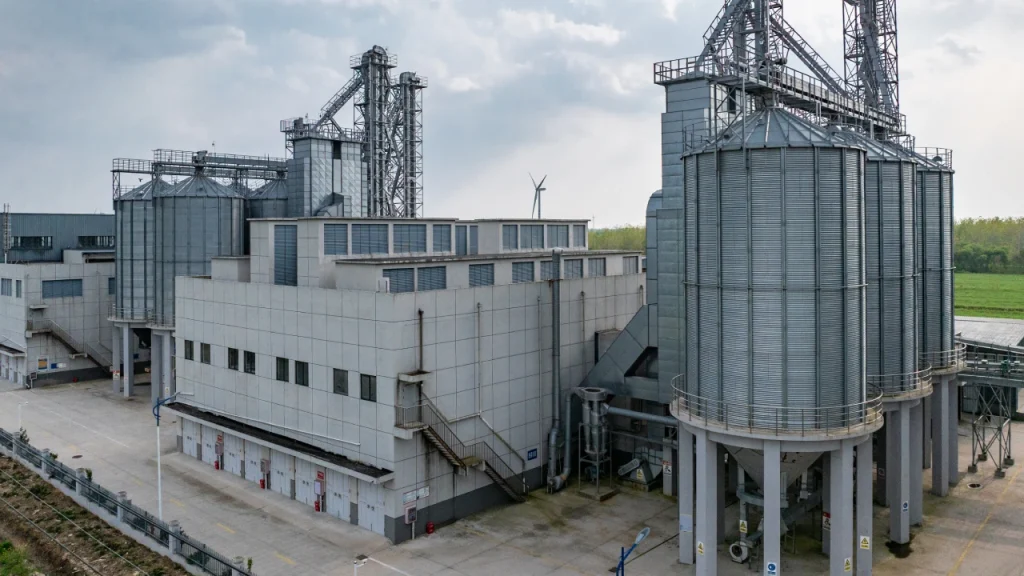
To understand the largest companies, you must first understand the architecture of the industry. The global agriculture market operates through three distinct but heavily overlapping segments.
Agribusiness Traders and Processors
Often referred to as the ABCD companies, this segment includes giants like Cargill, ADM, and Bunge. They are the middlemen of the global food system. They do not typically grow crops; instead, they buy them from farmers, store them in massive silo networks, transport them via global shipping fleets, and process them into animal feed, biofuels, and food ingredients.
Their revenue model relies on extreme volume and tight margins. They generate profit by exploiting price differences across different geographic regions and timeframes. If a drought hits Argentina, these traders leverage their global logistics networks to source grain from the United States or Eastern Europe, capturing the price premium.
Input Companies
This segment includes chemical and seed titans like Bayer, Syngenta, Nutrien, and Corteva. They operate at the very beginning of the agricultural cycle. They provide the fundamental building blocks of farming: genetically modified seeds, synthetic fertilizers, herbicides, and pesticides.
Their revenue model is highly profitable and relies on intellectual property. Developing a new drought-resistant seed trait can take a decade and cost hundreds of millions of dollars. Once patented, farmers must buy these seeds every year, along with the chemical herbicides designed to work alongside them. Fertilizer companies like Nutrien rely on mining raw materials like potash and nitrogen, operating massive industrial processing facilities to supply essential plant nutrients.
Equipment Manufacturers
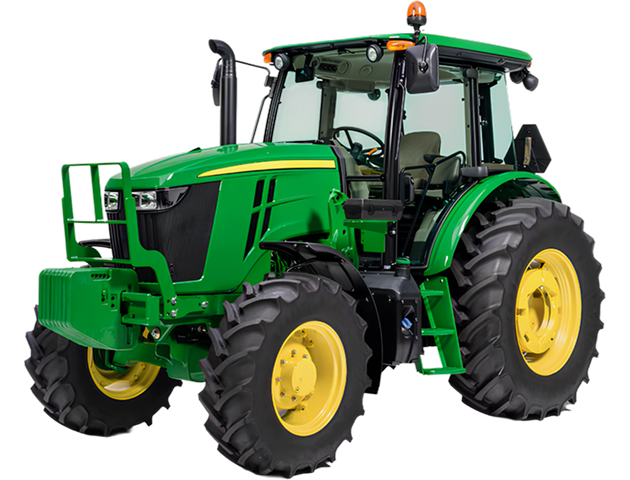
Companies like John Deere and CNH Industrial provide the mechanical muscle required to operate modern farms. They manufacture tractors, combine harvesters, planters, and sprayers.
In 2026, these companies generate revenue not just from selling heavy metal, but from selling software subscriptions, replacement parts, and financing. Modern agricultural equipment is highly computerized. A new combine harvester is essentially a mobile data center that happens to cut grain. Manufacturers generate massive recurring revenue by charging subscription fees for satellite guidance, yield mapping software, and automated steering systems.
How These Companies Are Connected Across Supply Chain
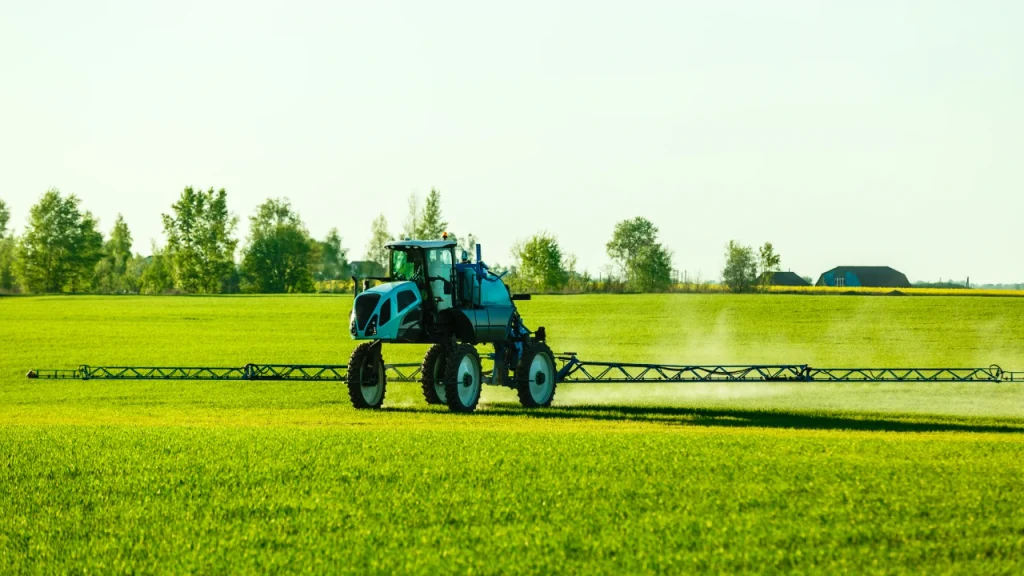
The true power of these agriculture companies becomes apparent when you map their interactions. Let us look at the mathematics and mechanics of a typical acre of corn in the United States to see how value is extracted at every step.
Imagine a farmer preparing for the spring planting season.
Step One: Inputs and Genetics
The farmer purchases genetically engineered seeds from Corteva and synthetic fertilizer from Nutrien. Let us calculate the baseline. Seed costs might run $120 per acre, while fertilizer and chemical protection add another $180 per acre. Before a single tractor enters the field, input companies have extracted $300 per acre in revenue.
Step Two: Machinery and Execution
The farmer uses a John Deere ExactEmerge planter to place those seeds into the ground at high speeds with millimeter precision. The planter and the tractor pulling it represent a capital investment of over $700,000. John Deere captures revenue from the initial sale, the financing interest through John Deere Financial, and the ongoing software subscription required to run the precision planting monitors.
Step Three: Growth and Data
Throughout the summer, the farmer applies Bayer crop protection chemicals using a self-propelled sprayer from CNH Industrial. The machinery constantly beams data back to corporate servers, logging chemical application rates and soil conditions.
Step Four: Harvest and Trading
In the fall, the farmer harvests the corn using a modern combine. The yield data is recorded. The farmer then loads the grain into trucks and delivers it to a local grain elevator owned by ADM.
Step Five: Processing and Export
ADM buys the corn at the current commodity market price. They load it onto barges, send it down the Mississippi River, and load it onto ocean freighters. ADM then processes that corn into ethanol fuel or high-fructose corn syrup, capturing the processing margin before selling to consumer brands.
This interconnected web shows why consolidation is so profitable. The farmer takes on the weather and yield risks, while the massive corporations extract guaranteed margins at the input, equipment, and processing stages.
How This Ranking Was Built
Creating a definitive ranking of agriculture companies requires a strict, data-driven methodology. Because many of these companies operate across multiple industries, we must isolate their agricultural impact.
Methodology Criteria
- Estimated revenue range: Based on projected 2026 fiscal year earnings, focusing on agricultural divisions. For chemical giants like BASF, we only calculate their Agricultural Solutions revenue, ignoring their plastics or automotive divisions.
- Global presence: Companies must operate on a multinational scale, influencing global trade flows rather than just regional markets.
- Market influence: We measure the ability of the company to dictate pricing, control supply chain bottlenecks, or establish industry standards.
- Vertical integration: Companies that control multiple layers of the agricultural process receive higher weighting due to their structural dominance.
This methodology ensures a consistent comparison across traders, chemical producers, and machinery builders, providing a true picture of who controls the global food system.
Top Agriculture Companies by Segment
Before diving into the detailed ranking, it helps to categorize the leaders by their primary operational segment.
Top Agribusiness Traders
Cargill, ADM, and Bunge dominate the physical movement and processing of global commodities.
Top Input Companies
Bayer, Syngenta, Nutrien, Corteva, and BASF control the chemical, biological, and nutritional foundations of crop growth.
Top Equipment Manufacturers
John Deere and CNH Industrial dictate the physical machinery and digital infrastructure used to plant and harvest.
Top Agriculture Companies in World (2026 Ranking)
The following table provides a high-level comparison of the top ten agriculture companies in 2026, followed by a detailed operational breakdown of each corporation.
| Company | Segment | Estimated Revenue | Core Markets | Strategic Role |
|---|---|---|---|---|
| Cargill | Trader / Processor | $165B – $175B | Global | Origination and logistics |
| ADM | Trader / Processor | $90B – $100B | Americas, Europe | Processing and ingredients |
| Bayer | Inputs (Seeds/Chem) | $25B – $28B | Global | Trait research and chemicals |
| John Deere | Equipment / Tech | $55B – $60B | Global | Machinery and precision ag |
| Syngenta | Inputs (Seeds/Chem) | $30B – $33B | Asia, Americas | Crop protection and genetics |
| Nutrien | Inputs (Fertilizer) | $28B – $32B | Americas, Australia | Potash and nitrogen supply |
| Corteva | Inputs (Seeds/Chem) | $18B – $20B | Americas, Europe | Agronomy and seed traits |
| CNH Industrial | Equipment / Tech | $22B – $25B | Global | Tractors and harvest machinery |
| Bunge | Trader / Processor | $55B – $60B | South America, Global | Oilseed processing |
| BASF | Inputs (Ag Division) | $10B – $12B | Europe, Global | Fungicides and herbicides |
Cargill
Segment: Agribusiness Trader and Processor
Estimated revenue range: $165 Billion – $175 Billion
Global footprint: Operates in over 70 countries, selling to 125 markets.
Cargill is the largest privately held corporation in the United States and the undisputed heavyweight champion of global agriculture. They buy, process, and distribute grain, oilseeds, and other commodities. They also operate massive meat processing facilities and produce animal nutrition products.
Competitive Advantage
Unmatched physical infrastructure. Cargill owns ports, ocean vessels, massive inland grain elevator networks, and thousands of miles of rail capacity.
Strategic Role in Global Agriculture System
Cargill acts as the central nervous system of global food logistics. When a country experiences a crop failure, Cargill is the entity capable of rerouting millions of tons of grain across oceans to prevent shortages, capturing significant profit margins in the process.
ADM
Segment: Agribusiness Trader and Processor
Estimated revenue range: $90 Billion – $100 Billion
Global footprint: Heavy concentration in North America and Europe, with expanding South American operations.
Daniels Midland excels at taking raw commodities and turning them into value-added products. While they trade massive volumes of whole soybeans and corn, their real profit engine lies in crushing those commodities into vegetable oils, animal feed proteins, biofuels, and specialized food ingredients.
Competitive Advantage
Deep integration into the consumer packaged goods industry. ADM supplies the fundamental ingredients for thousands of items found in standard grocery stores.
Strategic Role in Global Agriculture System
ADM bridges the gap between raw farm output and industrial food manufacturing. They dictate the baseline prices farmers receive for grain at local elevators while simultaneously setting the wholesale ingredient costs for food manufacturers.
Bayer

Segment: Agricultural Inputs
Estimated revenue range: $25 Billion – $28 Billion (Crop Science Division)
Global footprint: Massive presence in North America, South America, and Europe.
Following its historic acquisition of Monsanto, Bayer became the dominant force in agricultural chemicals and seed genetics. They engineer seeds to resist specific insects and tolerate specific chemical herbicides, which they also manufacture and sell.
Competitive Advantage
Research and development scale. Bayer spends billions annually developing next-generation biological traits and customized chemical formulations that competitors cannot legally replicate.
Strategic Role in Global Agriculture System
Bayer dictates the baseline biological potential of global harvests. By controlling the genetics of major crops like corn and soybeans, they heavily influence global yield ceilings and farming methodologies.
Syngenta
Segment: Agricultural Inputs
Estimated revenue range: $30 Billion – $33 Billion
Global footprint: Strongest in Asia and the Americas.
Owned by ChemChina, Syngenta is a powerhouse in crop protection chemicals and seed technology. They provide farmers with the highly specialized fungicides, herbicides, and insecticides required to keep massive monoculture farms viable.
Competitive Advantage
Backing from the Chinese state apparatus gives Syngenta unparalleled access to the rapidly modernizing Asian agricultural market while maintaining a massive footprint in Western agriculture.
Strategic Role in Global Agriculture System
Syngenta secures global crop yields against disease and pests. Their chemical formulations are critical for maintaining the high-density farming practices required to feed growing global populations.
Nutrien

Segment: Agricultural Inputs (Fertilizer)
Estimated revenue range: $28 Billion – $32 Billion
Global footprint: Dominant in North America and Australia, major global exporter.
Nutrien is the world largest producer of potash and the third largest producer of nitrogen fertilizer. They mine raw minerals from the earth and process them into the essential nutrients that plants require to grow. They also operate a massive retail network, selling directly to farmers.
Competitive Advantage
Control of physical natural resources. Potash mines are incredibly expensive and difficult to develop. Nutrien controls some of the highest-yield mines on the planet, giving them structural pricing power.
Strategic Role in Global Agriculture System
Without synthetic fertilizers, global crop yields would collapse by an estimated 40 to 50 percent. Nutrien controls the literal fuel that drives global plant growth, making their supply chains critical to global food security.
Corteva

Segment: Agricultural Inputs
Estimated revenue range: $18 Billion – $20 Billion
Global footprint: Primarily Americas and Europe.
Formed from the merger and subsequent spin-off of Dow and DuPont agricultural divisions, Corteva focuses purely on agronomy. They produce elite seed genetics and crop protection chemicals.
Competitive Advantage
A massive library of proprietary seed germplasm. Corteva holds patents on some of the highest-yielding corn and soybean genetics in existence.
Strategic Role in Global Agriculture System
Corteva pushes the boundaries of agronomic science. They provide the high-performance genetics that allow farmers in regions like the American Midwest to achieve record-breaking yields year after year.
John Deere
Segment: Equipment Manufacturers
Estimated revenue range: $55 Billion – $60 Billion
Global footprint: Global dominance, particularly strong in North America and South America.
John Deere manufactures premium agricultural machinery. However, in 2026, their business model is heavily focused on precision agriculture software, autonomous driving technology, and financial services.
Competitive Advantage
The green paint ecosystem. John Deere has successfully integrated their machinery, software displays, and proprietary data networks so deeply that switching to a competitor becomes operationally painful for farmers.
Strategic Role in Global Agriculture System
John Deere provides the physical execution layer of modern farming. Their machines dictate how efficiently seeds are planted and how effectively crops are harvested, while their data platforms serve as the central hub for farm management.
CNH Industrial
Segment: Equipment Manufacturers
Estimated revenue range: $22 Billion – $25 Billion
Global footprint: Global reach, strong European and American market share.
Operating primarily through the Case IH and New Holland brands, CNH Industrial provides a full spectrum of agricultural machinery, from massive articulated tractors to vineyard equipment.
Competitive Advantage
Brand diversity and specialized equipment. While John Deere dominates row-crop farming, CNH captures massive market share in agriculture, livestock feeding equipment, and mid-sized farming operations.
Strategic Role in Global Agriculture System
CNH ensures global mechanical diversity. They provide the heavy equipment necessary for diverse agricultural environments, from massive Brazilian soybean fields to compact European dairy farms.
Bunge

Segment: Agribusiness Trader and Processor
Estimated revenue range: $55 Billion – $60 Billion
Global footprint: Unrivaled dominance in South America, major global presence.
Bunge specializes in oilseeds. They are the premier buyer and processor of soybeans globally. They crush beans into oil for cooking and industrial use, and meal for livestock feed.
Competitive Advantage
Infrastructure density in Brazil and Argentina. Bunge controls the logistics networks in the fastest-growing agricultural regions on earth, giving them first access to massive South American harvests.
Strategic Role in Global Agriculture System
Bunge connects the massive production capacity of South America with the massive consumption demand of Asia, specifically China. They are the primary conduit for global protein supply chains.
BASF
Segment: Agricultural Inputs (Ag Division)
Estimated revenue range: $10 Billion – $12 Billion
Global footprint: Strong European base, expansive global reach.
BASF Agricultural Solutions focuses heavily on chemical crop protection, particularly fungicides and herbicides. They also invest heavily in digital farming platforms and biological alternatives to synthetic chemicals.
Competitive Advantage
Deep chemical engineering expertise backed by the broader BASF corporate structure, allowing for rapid innovation in complex chemical formulations.
Strategic Role in Global Agriculture System
BASF provides the chemical tools farmers need to fight evolving plant diseases and herbicide-resistant weeds, ensuring harvest stability in challenging climate conditions.
Market Concentration: Who Controls Global Agriculture
When we analyze the data across these ten companies, a stark picture of market concentration emerges. Economists often use the Herfindahl-Hirschman Index (HHI) to measure market concentration, but looking at simple market share percentages paints a clear enough picture.
In the input sector, just four companies (Bayer, Corteva, Syngenta, and BASF) control over 50 percent of proprietary seed sales and over 70 percent of agricultural chemicals globally. This means that when a farmer decides what to plant, they are almost certainly buying from this oligopoly. This concentration gives these companies massive pricing power. If fertilizer and chemical prices rise, farmers have almost no alternative suppliers to turn to.
The trading sector is equally tight. The ABCD companies handle the vast majority of international grain shipments. If a buyer in Egypt needs a million tons of wheat, they are negotiating with a tiny club of corporate traders who have perfect visibility into global supply and demand dynamics.
However, concentration in the machinery sector is perhaps the most visible on a daily basis. John Deere and CNH Industrial dominate the heavy tractor and combine markets. This consolidation directly impacts equipment availability, dealer networks, and secondary market pricing.
Agriculture Industry Trends Shaping Market
As we move through 2026, several macro trends are forcing these massive companies to adapt and consolidate even further.
First, digital agriculture and data monetization have entirely changed the business models of input and equipment companies. Machinery is now sold as a platform. Companies charge recurring subscription fees to unlock horsepower, activate GPS guidance, or access yield mapping software. This creates a continuous revenue stream long after the physical tractor is sold.
Second, sustainability mandates and carbon markets are reshaping supply chains. Governments in Europe and North America are heavily regulating chemical runoff and carbon emissions. In response, input companies are acquiring biological startup firms to develop natural pesticides. Meanwhile, traders like Cargill and ADM are building massive carbon-tracking databases, paying farmers small premiums to adopt no-till farming practices so the traders can sell carbon-neutral grain to food brands at a massive markup.
Third, global trade shifts are forcing supply chain realignments. Geopolitical friction has made long-distance agricultural trade more volatile. Companies are nearshoring processing facilities and building redundant logistics networks to ensure they can bypass blocked straits or sanctioned regions.
Equipment Manufacturers vs Agribusiness Giants
While traders and input companies deal in biology and logistics, equipment manufacturers operate in the realm of heavy metal and mechanical execution. It is crucial to differentiate their roles within the ecosystem.
Input companies create the potential for a crop. Traders monetize the output of that crop. Equipment manufacturers provide the tools required to turn potential into reality.
However, equipment companies are increasingly acting like input companies. Just as Bayer locks a farmer into a chemical regimen, John Deere locks a farmer into a digital ecosystem. Modern tractors require proprietary diagnostic software to repair. If a sensor fails on a combine during harvest, the farmer cannot simply fix it with a wrench; they must call a certified dealer with the correct software key.
This dynamic places equipment manufacturers in a unique position of power. They do not just sell machines; they sell operational uptime.
How These Companies Influence Equipment Markets
The massive scale of manufacturers like John Deere, CNH Industrial, and AGCO gives them total control over the agricultural equipment market. This influence manifests in several highly impactful ways.
Pricing Power and Margin Expansion
Because there are so few competitors in the high-horsepower tractor and combine segments, manufacturers can steadily increase prices. A new Class 9 combine harvester in 2026 easily exceeds $700,000 before adding headers or advanced software packages. Manufacturers justify these prices by pointing to increased efficiency and automation, but the reality is that buyers simply have no cheaper alternatives for new equipment at that scale.
Control Over Dealer Networks
Manufacturers exert immense pressure on independent dealerships. Over the last decade, we have seen massive dealer consolidation. Manufacturers push local, single-store dealers to sell out to massive mega-dealership groups that span multiple states. This reduces local competition. When one mega-dealer owns all the brand franchises within a 300-mile radius, buyers lose the ability to cross-shop and negotiate favorable terms.
Impact on Secondary Markets
To protect new equipment sales, manufacturers tightly control the certified pre-owned market. They dictate trade-in values and manage inventory aggressively. If a mega-dealer takes in too many used 2023 tractors, the manufacturer might offer special financing to move them, or conversely, restrict parts availability for older models to force buyers into new upgrades.
What This Means for Equipment Buyers and Dealers
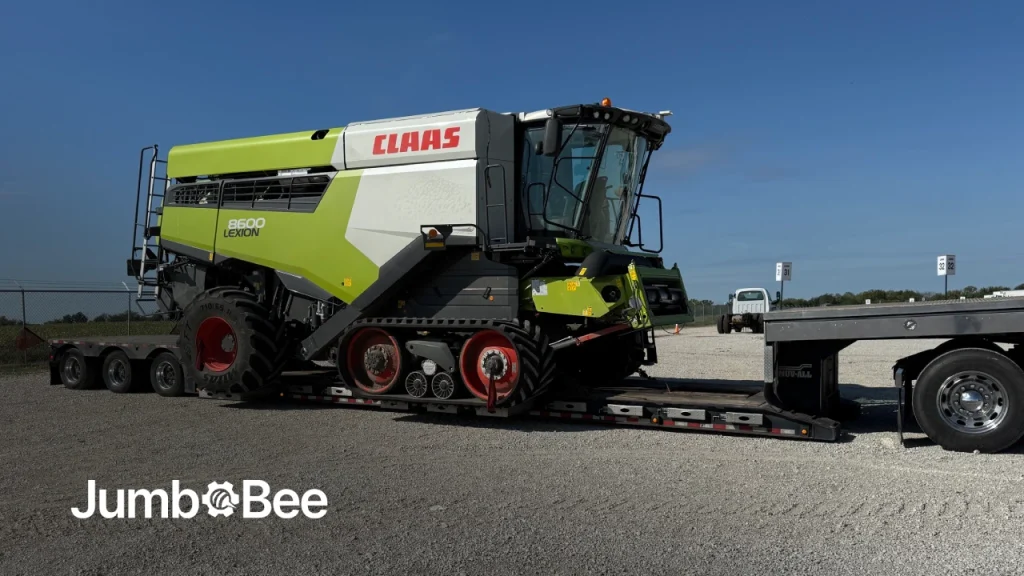
For the end user — whether an independent farmer in the American Midwest, an agricultural systems integrator in Mongolia, or a fleet manager in Egypt — this corporate consolidation creates significant friction.
Local access to high-quality equipment is shrinking. If you rely solely on traditional dealer networks, you are subject to whatever inventory they decide to stock and whatever prices the consolidated dealership group dictates. You are essentially trapped in a localized monopoly.
Furthermore, the rising cost of new machinery has made the used equipment market absolutely vital for business survival. A late-model used tractor offers 95 percent of the capability of a brand-new machine at a fraction of the cost. For example, purchasing a used 2021 John Deere 8R 370 with 859 hours for around $366,000 represents massive capital savings compared to buying a 2026 equivalent.
However, sourcing these used machines locally is often impossible. The local dealer simply might not have the horsepower, hydraulic configuration, or track spacing you need.
Where to Source Equipment in Consolidated Market
To bypass the limitations of consolidated local dealer networks, smart buyers are turning to global sourcing. The internet has democratized access to heavy machinery, breaking the geographical monopolies held by mega-dealers.
When you cannot find the right machine locally, or when local prices are artificially inflated, you must expand your search radius. The United States remains the premier source for high-quality used agricultural equipment. American farmers trade in machinery frequently to capture tax depreciation benefits, resulting in a massive supply of well-maintained, low-hour tractors and combines entering the secondary market.
The challenge historically has been logistics. How does a buyer in Ukraine or Egypt safely purchase a combine in Illinois and get it shipped across the ocean without getting scammed or buried in hidden export fees?
This is where global marketplaces like JumboBee change the game entirely. By utilizing this platform that handles end-to-end logistics, verifies sellers, and provides transparent pricing, buyers can access the massive American secondary market with zero friction. You are no longer limited to what the local corporate dealer wants to sell you; you have access to thousands of machines globally.
Key Takeaways
Navigating the 2026 agricultural landscape requires understanding the forces at play.
- Agriculture is highly concentrated: A small fraction of corporations control the vast majority of global inputs, trading, and equipment manufacturing.
- Corporations dominate supply chains: From the genetic code of a seed to the digital code in a tractor, massive companies extract value at every step of the farming process.
- Segments are deeply interconnected: Traders rely on the high yields generated by input companies, which are harvested by the precision machinery built by equipment manufacturers.
- Local options are shrinking: Dealership consolidation means local buyers face higher prices and limited inventory for vital heavy machinery.
- Global sourcing is essential: To maintain profitability and secure the right machinery, buyers must bypass local monopolies and utilize global marketplaces to source high-quality used equipment.
Explore Agriculture Equipment from Global Suppliers
Corporate consolidation does not have to dictate your operational success. If local dealer networks are limiting your access to essential machinery or pricing you out of the market, it is time to expand your reach.
JumboBee provides the ultimate solution for navigating the consolidated heavy equipment market. We connect you directly with verified sellers of premium agricultural machinery, unlocking access to thousands of high-quality, low-hour units from top brands like John Deere, Case IH, CLAAS, and New Holland.
We eliminate the risks of international trade. When you find the perfect tractor or combine, you see the full cost instantly — including equipment, shipping, inspections, and fees. No hidden charges. No surprises. Our team handles the entire logistical process, from custom disassembly and loading to export compliance and door-to-door global shipping.
Stop settling for limited local inventory and inflated corporate pricing. Take control of your equipment sourcing today. Browse our global inventory of farm equipment, compare listings, and start trading smarter.
Explore Global Farm Equipment Catalog on JumboBee.





Be the first to leave a comment
There are no replies to this post yet. Share your thoughts and help start the conversation.